Fast Setup
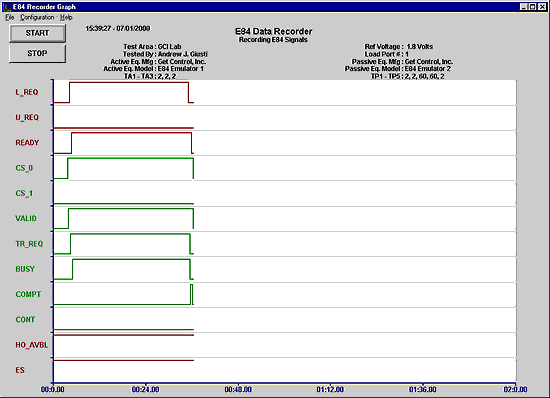
The Configuration menu provides data acquisition and display options. The timing diagram displays standard E84 interbay signals for both the passive (L_REQ, U_REQ, READY, HO_AVBL and ES) and active (CS_0, CS_1, VALID, TR_REQ, BUSY, COMPT, and CONT) entities. Configuration options allow the addition of the three E84 defined reserved signals (typically used as optical transceiver control signals).
Data acquisition options available from the configuration menu include communications port selection (used to connect to the E84 DLD / RJ-11 Optical Transceiver), and default recording X-axis time scale. Test information can also be entered to help identify the specific recording. Available fields include operator name, test location, equipment manufacture and model number, and timeout values. A large free format comment field is also provided.
Live Recoding
When connected to an E84 DLD or RJ-11 Optical Transceiver, the E84 Analysis Application can display real-time diagrams of E84 signals during an AMHS handoff. Schedule an AMHS delivery, and watch the E84 communications taking place between the delivery system and the equipment as the FOUP is being loaded or unloaded.
Powerful Analysis
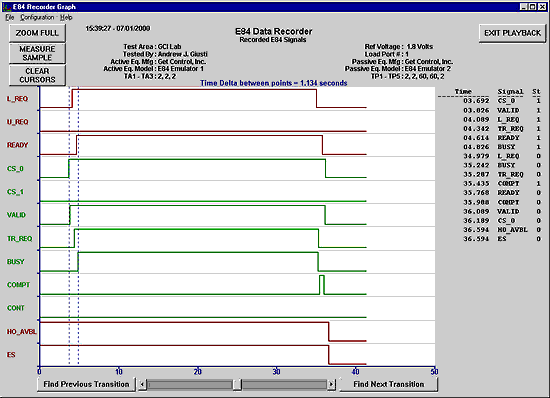
The E84 Analysis Application provides powerful, yet easy to use tools, that can be used to examine recorded E84 data. Initially, the entire recorded data set is displayed on a timing diagram. Using the interactive zooming, scrolling, and search features, you can quickly locate and view even the smallest details of your recorded data. A time-stamped signal state change table is also provided for reference. Plus, the Error Analysis tool scans through the data set and pinpoints failed handoffs.
Automatic Error Analysis
Scan through days worth of recorded data and pinpoint each failed handoff. The Error Analysis tool starts analyzing the data currently displayed, and moves forward in time comparing each handoff recorded against the published specification. When the data recorded does not match the published specification, the E84 Analysis Application re-draws the timing diagram, showing the failed handoff. A detailed description is given explaining why the handoff was flagged as bad. This includes the spot in the handoff where the error occurred, which signals were involved, and what was expected. A table is also displayed showing the status of each E84 signal at the time of the error, along with their expected status.
Zoom
Focus in on a specific area of data with the Graph Zoom tool. Simply draw a rectangle around a specified area on the timing diagram to expand the area of interest. Select the Zoom Full button to re-display the entire recorded data set.
Pan
Pan forward and back through the recorded data set using the Playback Scroll feature. A single scroll bar provides three scrolling methods for rapid, fine and extra fine scrolling.
Measure
Measure the time between any two signal transitions using the Delta Signal Measurement tool. This tool can measure the time between two transitions on the same signal or between transitions on different signals.
Search
Search for an event on a specific signal with the Transition Search tool. Use this tool to locate the next or previous signal transition of a specific signal from the current location in the recorded data set.
Save and Export Data
Recorded data can be saved and reloaded for analysis at a later time. Options are also provided for exporting data for printing or sharing with other applications such as word processors and spreadsheets. Create a formatted ASCII text file of the recorded data using the Export Data to Text File feature. The Export Graph as Bitmap option creates a bitmap file of the currently displayed graph.


